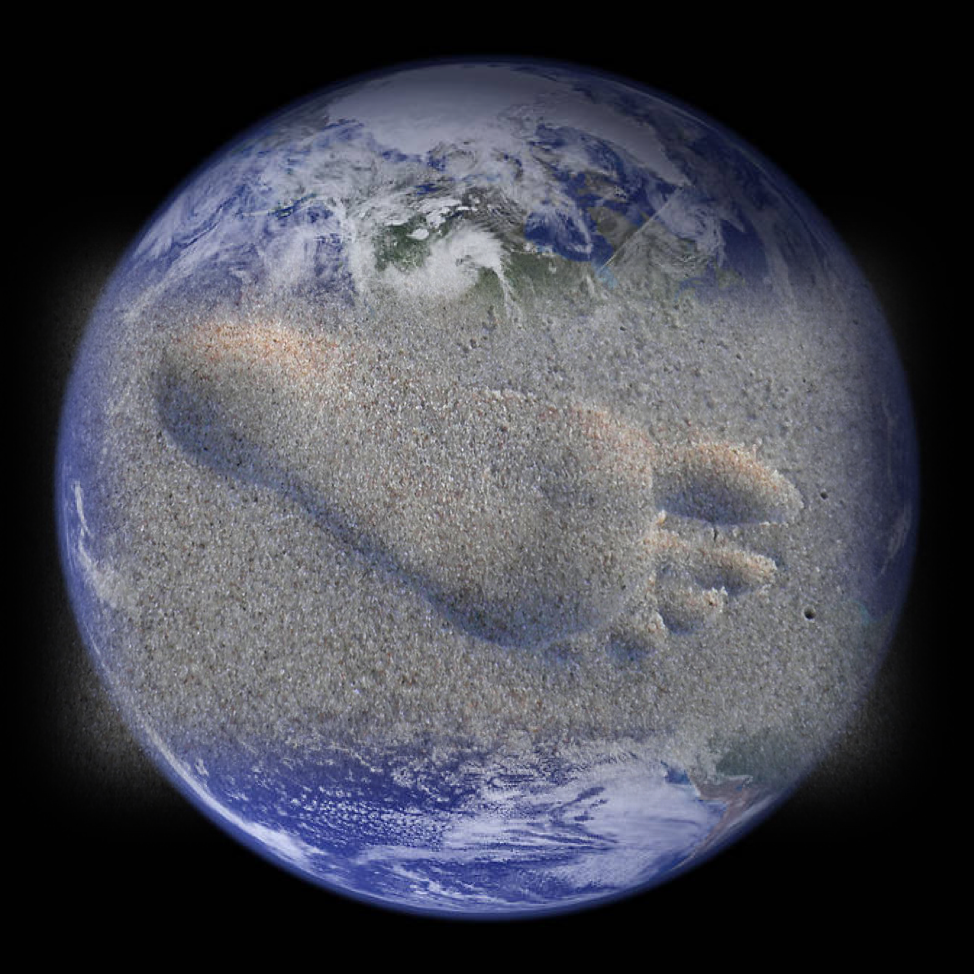
A human-dominated Earth System
(Source unless otherwise noted for “Summary of findings” #1-10: Song, X.-P., Hansen, M. C., Stehman, S. V., Potapov, P. V., Tyukavina, A., Vermote, E. F., & Townshend, J. R. (2018). Global land change from 1982 to 2016. Nature. doi:10.1038/s41586-018-0411-9)
Globally, land-use change is the direct driver with the largest relative impact on terrestrial and freshwater ecosystems. {2.2.6.2}. (IPBES)
Land-use change is driven primarily by agriculture, forestry and urbanization, all of which are associated with air, water and soil pollution. {2.1.11} (IPBES)
Summary of Findings
Direct human action on landscapes is found over large areas on every continent, from intensification and extensification of agriculture to increases in forestry and urban land uses, with implications for the maintenance of ecosystem services.
1. Global tree cover has increased 7.1% relative to 1982
2. Net gain is the result of greater tree cover gain in the subtropical, temperate and boreal climate zones relative to net loss in the tropics
3. Global bare ground cover has decreased by 3.1%, primarily in agricultural regions in Asia
4. 60% of all land changes are associated with direct human activities; 40% with indirect drivers such as climate change
a. Direct human activities–36% for bare ground
b. Direct human activities–70% for tree canopy loss
c. Direct human activities—86% of changes in Europe, 66% South America, 62% Asia, 50% Africa
5. Across all climate domains: montane systems have gained tree cover, many arid and semi-arid ecosystems have lost vegetation cover
6. On a global scale, the growth of urban areas accounts for a small fraction of all land changes.
7. Changes were unevenly distributed across biomes
a. Tree canopy loss (relative to 1982): tropical dry forest biome
(-8%), moist deciduous forest (-2%)
b. Tree canopy gains: temperate continental forest (+33%), boreal coniferous forest (+12%), subtropical humid forest (+18%)
c. Short vegetation loss: temperate continental forest (-14%), boreal coniferous forest (-10%), subtropical humid forest (-9%)
d. Short vegetation gain: tropical shrubland (+10%), tropical dry forest (+5%)
e. Bare ground loss: tropical shrubland (-10%),
f. Bare ground gain: subtropical desert (+4%), subtropical steppe (+5%)
Expansion of the agricultural frontier
Nearly 40% of the terrestrial environment is devoted to agriculture.


Source: World Bank Data Agriculture
8. Expansion of the agricultural frontier is the primary driver of deforestation in the tropics
a. South America—The three countries with the largest area of net tree cover loss during 1982–2016 are all located in South America: Brazil (−385,000 km2, −8%), Argentina (−113,000 km2, −25%) and Paraguay (−79,000 km2, −34%)
(i.) Brazil: Clearing for industrial agriculture in the Cerrado and Gran Chaco; largest gain in short vegetation (+12%) mainly due to expansion of agricultural frontiers into natural ecosystems

Global Forest Watch. 2014. World Resources Institute. Accessed on (July 24, 2019). www.globalforestwatch.org.

Source: https://commons.wikimedia.org/wiki/File:Desmatamento_no_Brazil,_por_bioma,_de_2002_a_2008..jpg
Português: Mapa do Desmatamento no Brasil, de 2002 a 2008. Fontes: Prodes (INPE) e Monitoramento por Biomas (IBAMA). Obs: O monitoramento não cobre as áreas de vegetação de Cerrado e Campinarama localizadas no Bioma Amazônico. Autor: Vitor Vieira Vasconcelos (2012)Location of the Cerrado; deforestation 2002-2008


Deforestation in Gran Chaco dry forest. Landsat 8 image August 14, 2016. About 20% (55,000 square miles) of the Gran Chaco has been deforested since 1985. 17,000 square miles of forests have been lost in Paraguay between 1987-2012. NASA Earth Observatory image by Michael Taylor, using Landsat data from the USGS.

https://commons.wikimedia.org/wiki/File:Desmatamento_no_Brazil,_por_bioma,_de_2002_a_2008..jpg
(ii) Argentina and Paraguay
Tree cover loss in Argentina and Paraguay 2001-2018
Global Forest Watch. 2014. World Resources Institute. Accessed on (July 24, 2019). www.globalforestwatch.org.


8b. Queensland, Australia.
In 2010, Queensland had 9.06Mha of natural forest, extending over 5.3% of its land area. In 2018, it lost 21.5kha of natural forest. Global Forest Watch. 2014. World Resources Institute. Accessed on (July 24, 2019). www.globalforestwatch.org

Tree Loss Australia, inset showing Queensland
8c. Southeast Asia Source: Global Forest Watch. 2014. World Resources Institute. Accessed on (July 24, 2019). www.globalforestwatch.org

(i) Myanmar


(ii) Vietnam


(iii) Indonesia
- In 2010, Indonesia had 137Mha of natural forest, extending over 73% of its land area.
- In 2018, it lost 1.22Mha of tree cover, equivalent to 480Mt of CO₂ of emissions. 340kha of this loss occurred within primary forests and 907kha within natural forest.
- Indonesia lost 6 Mha of old-growth and selectively logged natural forests between 2000 and 2012, and surpassed Brazil in the rate of its forest clearance in 20121
- Indonesia is the world’s largest palm oil producer; 80% of its palm oil is exported, of which 66% is shipped to India, China, Pakistan, Malaysia, Italy, Egypt and the United2 Kingdom.


1 Gaveau, et al., Rapid conversions and avoided deforestation: examining four decades of industrial plantation expansion in Borneo, Scientific Reports 6(32017), 2016.
2 Rulli, et al., Interdependencies and telecoupling of oil palm expansion at the expense of Indonesian rainforest, Renewable and Sustainable Energy Reviews,Volume105,May2019,499-512. https://doi.org/10.1016/j.rser.2018.12.050
(iv) Borneo (https://www.cifor.org/map/atlas/)
Borneo, Earth’s third largest island with 73.7 million ha (Mha) feeds the world with palm oil, a multi-billion-dollar business encompassing cosmetics, processed food and biofuels. With 8.3 Mha of industrial oil palm plantations, about half of the estimated global planted area of 18 Mha, Borneo is perhaps the world‘s largest center of palm-oil production. Pulpwood plantations (1.3 Mha) – mainly fast growing Acacia and Eucalyptus – make a major contribution to the global production of wood pulp.

Borneo is shared by Indonesia, Malaysia, and Brunei. It has the largest deforestation rates in the world, with an average 350,000 ha cleared every year between 2001 and 2016.

Borneo Forested Area 2016
76%, or 55.8 million hectares, of Borneo was old-growth rainforest (green) in 1973. Old-growth forest ecosystems are intact and include many old (>500 years) closed-canopy evergreen trees.
About 18.7 Mha of old-growth forest area was destroyed between 1973 and 2015 by fire, agricultural expansion, mining and hydropower dams. By 2015, 50% of the island shared by Malaysia, Indonesia and Brunei remained forested, with 28% old-growth rainforest, 22% logged-over (still in good condition), and 12% covered in industrial plantations (9.2 Mha).
Borneo, Indonesian Borneo in particular, suffered large-scale forest loss prior to the expansion of Industrial plantations. This cleared land permitted the development of some large-scale industrial plantations without necessarily causing additional forest loss. Nonetheless, in the last decade plantations have become the primary cause of direct deforestation.
3 Gaveau, et al., Rapid conversions and avoided deforestation: examining four decades of industrial plantation expansion in Borneo, Scientific Reports 6(32017), 2016
8d. Sub-Saharan Africa: smallholder agriculture and commodity cultivation
(i) Congolian rainforest
- (second largest tropical rainforest in the world after Amazonia*)
- Unpaved logging roads used by timber firms, as well as paved and unpaved public roads, have expanded greatly. Comparing old (before 2003) and new (2003–2018) road datasets derived from Landsat imagery, … the total length of road net-works inside logging concessions in Central Africa has doubled since 2003, whereas the total length of roads outside concessions has increased by 40%.*
- Annual deforestation rates between 2000 and 2017 near (within 1 km) roads increased markedly and were highest for old roads, lowest for abandoned roads and generally higher outside logging concessions.*
The impact of logging on deforestation is partially ameliorated by the nearly fourfold higher rate of road abandonment inside con- cessions, but the overall expansion of
logging roads in the Congo Basin is of broad concern for forest ecosystems, carbon storage and wildlife vulnerable to hunting.*
*Source: Kleinschroth, et al., Road expansion and persistence in forests of the Congo Basin, Nature Sustainability, Volume 2, July 2019, 628-634
Impacts from climate change
9a. Western United States: forest impacts due to insects, wildfires, heat, drought
9b. Arctic: warming is facilitating woody vegetation growth in northeastern Siberia, western Alaska and northern Quebec
9c. Central and West Africa: forest expansion and woody encroachment probably due to increased CO2 and precipitation
9d. Sahel: greening due extreme high-rainfall anomalies
9e. Altitudinal biome shifts: global treeline positions have been advancing since AD 1900
9f. Montane biomes: overall bare ground loss, short vegetation loss and bare canopy gain
Political, social, economic factors
10a. Europe and European Russia: tree canopy increase of 35% after the fall of the Soviet Union
10b. China: +34% tree canopy gain due to reforestation/afforestation; second largest loss of bare ground due to resource extraction and urban sprawl
10c. United States: +15% tree canopy gain mostly in the eastern US
10d. India: largest bare ground loss of all countries (-34%); second in short vegetation gain (+9%) primarily due to intensification of existing agricultural lands—continuation of the “Green Revolution.”
Arid and semi-arid drylands: long-term land degradation
11a. Large areas of decrease in short vegetation and large areas of increase in bare ground
11b. Hotspots of vegetation loss include the southwestern United States, southern Argentina, Kazakhstan, Mongolia, Inner Mongolia, China, Afghanistan and large areas of Australia.
(i.) Australia: decrease in short vegetation: long-term decline in local growing season
(ii.) Mongolian steppe: Rising surface temperatures, a reduction in rainfall, and overgrazing caused extensive grassland deterioration
(iii.) United States (southwest): degradation of soils and vegetation combined with an increased dominance of invasive species
Intact Forest Landscapes (IFLs)
Source: P. Potapov, M. C. Hansen, L. Laestadius, S. Turubanova, A. Yaroshenko, C. Thies, W. Smith, I. Zhuravleva, A. Komarova, S. Minnemeyer, E. Esipova, The last frontiers of wilderness: Tracking loss of intact forest landscapes from 2000 to 2013. Sci. Adv. 3, e1600821 (2017).
Definition: “(I)ntact forest landscape (IFL) (are) a seamless mosaic of forests and associated natural treeless ecosystems that exhibit no remotely detected signs of human activity or habitat fragmentation and are large enough to maintain all native biological diversity, including viable populations of wide-ranging species.”
Signficance: These areas have the highest conservation value in terms of the range of ecosystem services they provide, including harboring biological diversity, stabilizing terrestrial carbon storage*, regulating hydrological regimes. The size of these areas and degree of intactness, lack of degradation and fragmentation are critical to their function and conservation value.
*Although the remaining IFLs comprise only 20% of tropical forest area, they account for 40% of the total aboveground tropical forest carbon.
Status (2000-2013) (See Figure 1 and Table 1)
- Between 2000-2013 global IFL area decreased by 7.2%
- Global IFL loss is driven by large losses in tropical South America and Africa, accounting for 60% of global loss
- Drivers of IFL loss are driven (in order of importance) by industrial timber extraction, agricultural expansion (South America), forest fires, energy production (oil and gas extraction and hydropower)
- Fragmentation of IFLs by logging and establishment of roads and other infrastructure initiates a cascade of changes that lead to landscape transformation and loss of conservation values.
- Fragmentation of IFLs by logging and establishment of roads and other infrastructure initiates a cascade of changes that lead to landscape transformation and loss of conservation values.


